Mapping Participant Device Preferences Against Entry Completion Rates in Layered Digital Reward Verification Flows
Ulrich Long · Oct 24, 2026
Mapping Participant Device Preferences Against Entry Completion Rates in Layered Digital Reward Verification Flows
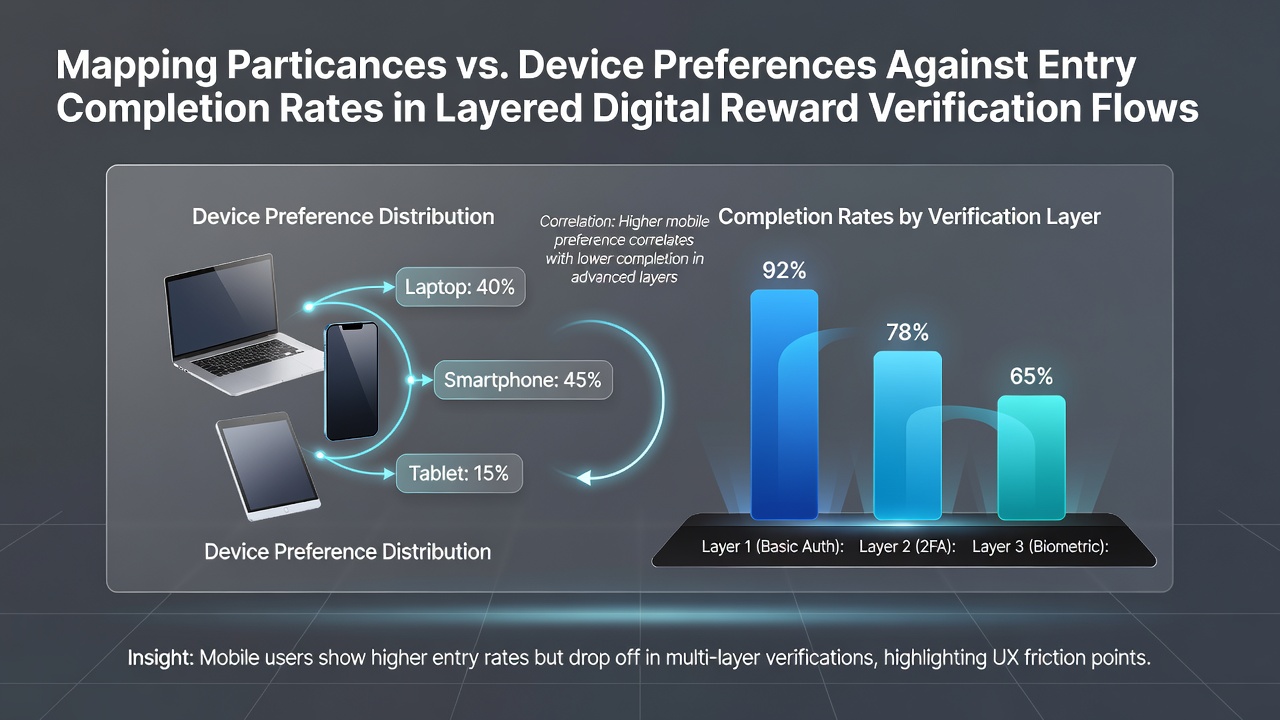
Researchers track participant device preferences against entry completion rates within layered digital reward verification flows because mobile phones, tablets, and desktop computers each present distinct interface constraints that influence how users progress through sequential checks such as email confirmation, phone validation, and identity document upload. Data from multiple platform operators reveal consistent patterns where mobile sessions account for roughly 68 percent of initial entries yet exhibit lower progression past the second verification layer compared with desktop sessions that maintain steadier advancement through all stages.
Device Categories and Their Role in Verification Sequences
Analysts categorize devices into smartphones, tablets, and desktop or laptop computers then map each category against completion percentages at every verification stage because screen size, input method, and network stability differ markedly across these groups. Studies conducted by platform teams in North America and Europe show that smartphone users complete the first two layers at rates exceeding 80 percent, yet those figures drop to 54 percent once users reach document upload requirements that demand camera access and file handling precision. Tablet users follow a similar trajectory though their overall volume remains smaller while desktop participants sustain completion rates above 70 percent through the final layer because larger displays accommodate form fields and file selectors without requiring repeated scrolling or zooming.
Data Collection Methods and Analytical Approaches
Platform operators collect anonymized session logs that record device type, operating system version, entry timestamp, and completion status at each verification gate then apply statistical mapping techniques to identify correlations. These logs feed into dashboards that segment results by geography and time of day so that regional variations become visible without exposing individual participant details. One research consortium based in Canada cross-referenced such datasets with broader digital access surveys and found that participants in urban areas with reliable broadband exhibited higher desktop completion rates whereas rural cohorts relied more heavily on mobile connections that encountered intermittent signal loss during extended verification sequences.
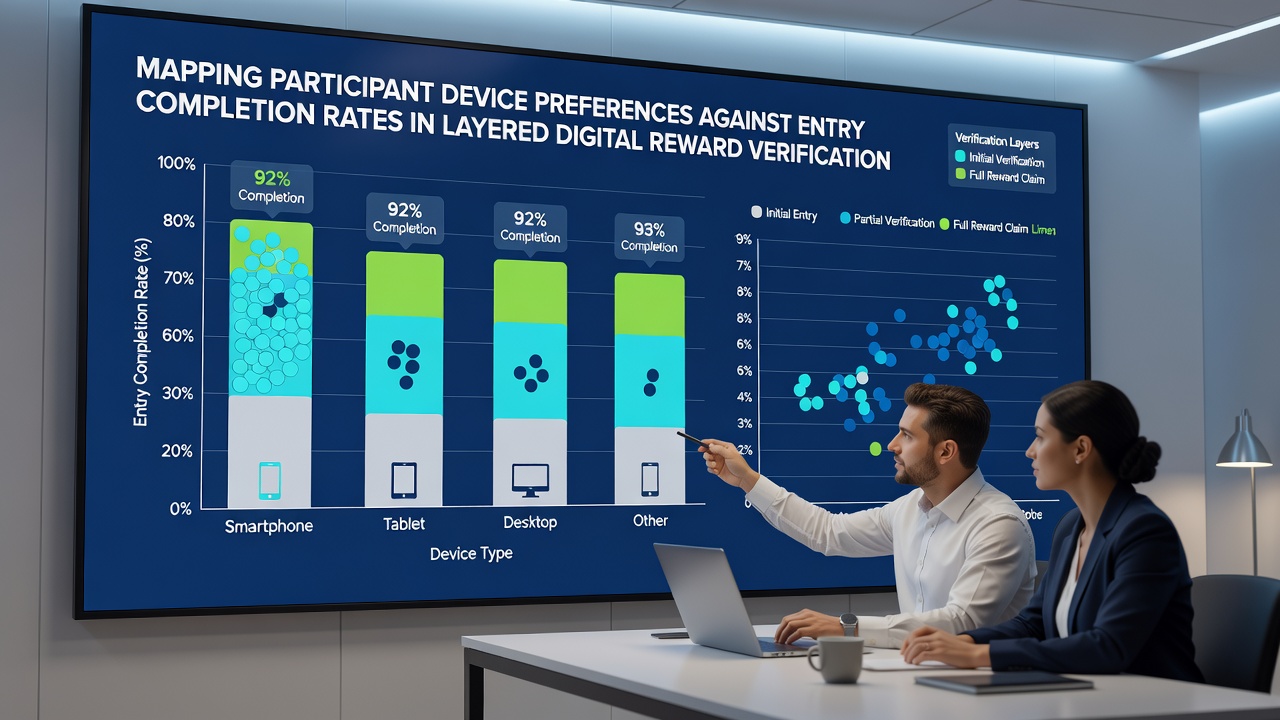
Statistical models further isolate variables such as browser version and connection speed to determine whether device preference alone drives outcomes or whether secondary factors intervene. Observers note that older operating systems on mobile devices correlate with abrupt session terminations at the third verification layer because compatibility issues prevent proper rendering of security prompts.
Regional Patterns and External Benchmarks
Figures released by Statistics Canada indicate that smartphone penetration among adults reached 87 percent in 2025 with corresponding increases in mobile entry attempts for reward programs. Parallel data from the European Commission digital economy reports show comparable trends across member states where mobile verification attempts outnumber desktop ones by nearly three to one. When these external benchmarks are overlaid onto platform completion metrics, analysts observe that regions with higher average mobile data costs experience steeper drop-offs after the second verification layer because users ration bandwidth during longer sessions.
Platform teams in Australia and the United Kingdom have begun publishing aggregated quarterly summaries that break down completion rates by device category and verification depth. These summaries enable operators elsewhere to compare their internal figures against broader industry baselines without sharing proprietary participant information. One analysis covering the period through October 2026 highlighted that desktop completion rates remained stable year-over-year while mobile rates showed modest improvement after interface adjustments that simplified file upload prompts.
Factors Influencing Device-Specific Outcomes
Network latency, camera resolution, and on-screen keyboard behavior each contribute to completion differences yet device category remains the primary grouping variable in most mapping exercises. Participants using older smartphones encounter more frequent timeouts during identity document capture because lower-resolution cameras struggle with glare or small text elements on government-issued IDs. Desktop users bypass these hardware limitations but may face separate friction when switching between browser tabs to retrieve verification codes sent via email or SMS.
Security protocols that require real-time facial matching introduce additional device-dependent variables because front-facing camera placement and quality vary widely across smartphone models. Researchers adjust their models to account for these hardware differences so that observed completion gaps reflect genuine behavioral patterns rather than isolated technical failures.
Conclusion
Mapping exercises that align device preferences with layered verification completion rates supply platform operators with actionable segmentation data while preserving participant anonymity. Continued refinement of these analytical approaches supports more accurate forecasting of entry volumes and helps identify where targeted interface adjustments may reduce drop-off at specific verification gates across different device classes.